


Computer games and cutting-edge web tech? Yes please.
It’s not every day that you get asked…
“Can you make our VR game talk in real-time to a cloud database, use the graph data-structure that’s in our artificial intelligence platform, and use that data to customise the game remotely depending on who is playing?” - The MD Stuart Browne
...but when you’re a thoroughly nerdy dev, who’s also an avid gamer, it’s nice when you do.
Here at Resulting we’ve recently built a virtual reality computer game that we’re going to use to conduct some research.
We wanted to be able to store, report, and visualise the research results outside of the game environment. To do that, we needed to use an external database, and having recently used a type of database called a ‘graph database’ for our A.I. project, we knew it’d be a good match.
To utilise the graph database with our computer game, we also needed to build some software that enables the game to communicate with the database over the internet. That type of intermediary software is called an application programming interface (API).
This article is going to briefly cover what a graph database is, the benefits it offered us, and how our game-to-database API works.
What is a Graph Database and why did we use one for our SAP research?
 © Resulting Limited 2019
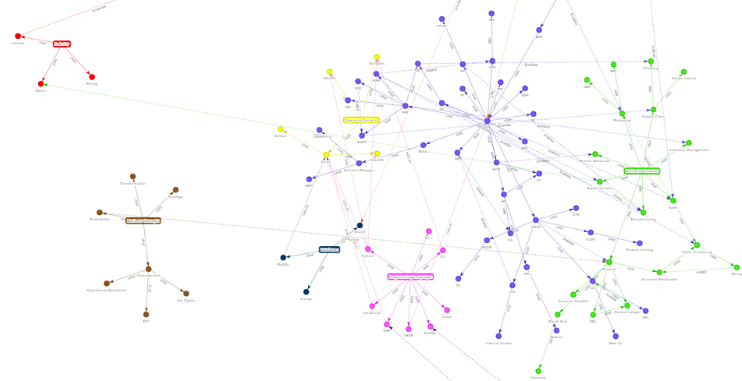
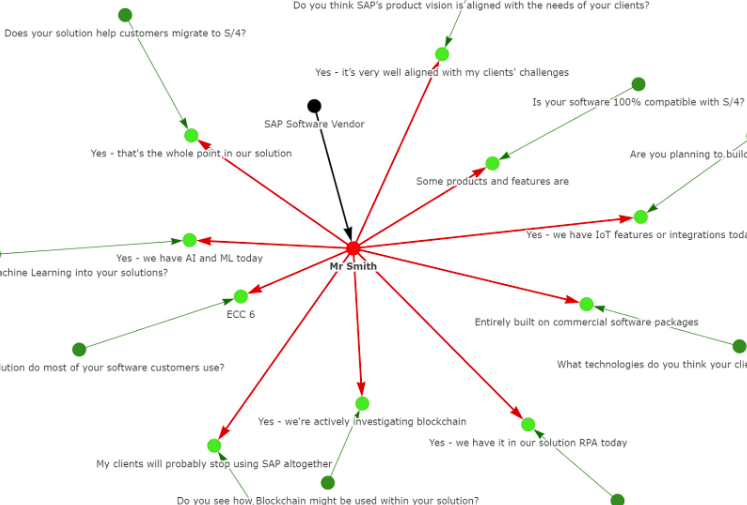
(This is how data from a graph database is presented)
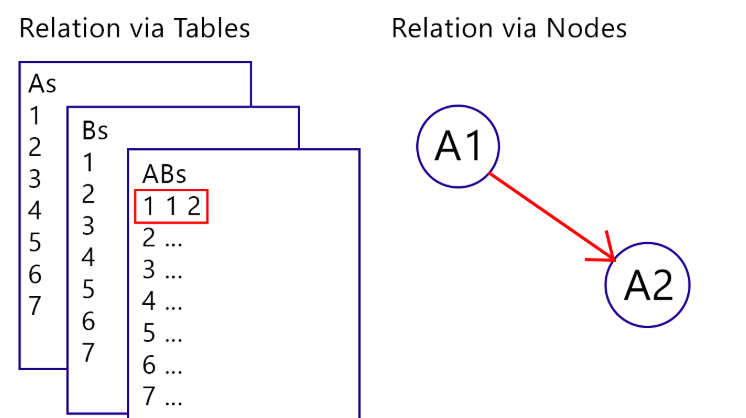
Graph databases are designed to treat relationships between data as importantly as the data itself. It does this by connecting the data points, called ‘nodes’, to each other directly, with another piece of data, called an ‘edge’ (the lines on the above image) which can have their own properties. You can then quickly see how things are related, without having to follow references.
That might seem complex at first, but once your graph of data is constructed, the simplicity of evaluating it enables extremely fast and versatile reporting, which is very powerful for any application that needs to conduct complex queries, or visualise relationship-based data.
We knew we wanted to query relationships between our data, “how many users of a certain job-role gave a certain answer”, and we wanted it to be as fast as possible so that we could display the results live, so graph suited our reporting requirements.
You can also add whatever information you like on a node, and then change it without having to redefine the structure of all nodes. Yes, it’s schema-free, which suits our current development methodology Agile. We wanted to start getting things done, and then iterate with as little refactoring as possible, not having to predefine or recreate table structures or inter-table relationships was a big bonus, so graph suited our development paradigm.
Catering for our need to visualise the results, graph has the added benefit of readily presenting data in a very intuitive way, especially for seeing relationships.
 © Resulting Limited 2019
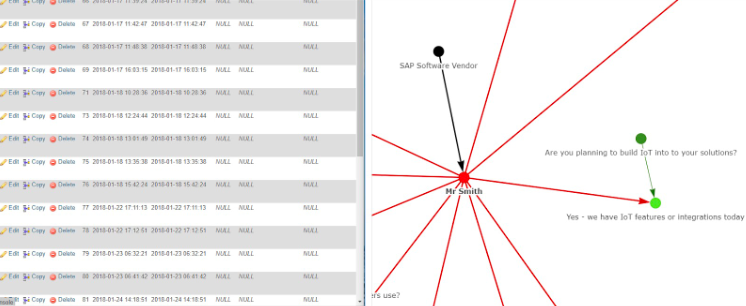
Which translates in the real-world to something like this:
 © Resulting Limited 2019
Graph therefore suited our visualisation needs as well.
So whilst we were only recently acquainted with graph databases through our recent forays into A.I., and admittedly wanted more experience with them, the benefits above, specific to the graph data model, made it a suitable fit for this project either way.
What is the API and how does it work?
Our API is a relatively small piece of software that we wrote in JavaScript. It sits in-front of the database and awaits certain instructions. You program it to accept a certain input, and then to go and do something, in our case, modify the database. (In tech jargon, we wrote an HTTP RESTful API in JavaScript utilising the open-source microservices framework FOXX).
We wanted the API to enable the user to be greeted with their name, presented questions based on their job role, and aggregate their results with other players of the same role. To do this we created several API ‘calls’ (a ‘call’ is just a specific operation the API carries out).
API call 1: Registering for the game on our website generates a unique PIN code, emails it to you, then the API creates you in the database, associating you with that PIN, and connects you to the appropriate job role.
API call 2: Put the headset on and enter the space station, you enter your PIN code, the API gets your name to greet you appropriately, “Greg Ellis, Welcome to the Research Centre”.
API call 3: You approach an interactive object in the game, the API uses your PIN alongside the object ID to find the appropriate questions and answers to present to you. “Hi Recruiter, what are you doing here?”
API call 4: When selecting answers the API creates ‘edges’ from the user to their answers in the database, which we can view live on an external monitor as it draws them:
 © Resulting Limited 2019
API call 5: Whilst walking around the game, the API finds users of the same job-role, aggregates their answers for the same questions and returns this to the game where it is displayed on the in-game screens so that you can compare your results.
That’s it for the API.
You can see how utilising external data via an API provided a lot of benefits, including remote user registration, remotely customising game content, and versatile reporting.
Final thoughts on our SAP virtual reality research tool
Learning to use a graph database was actually pretty fun, and even considering its unique query language, being able to view your data so intuitively made the learning curve fairly small. It benefited the project itself, and increasing our abilities with graph cross-pollinates our A.I. and data-visualisation project too, so it was a win-win from a technical perspective.
Utilising an API in this way was also a first for us and very rewarding. Helping a virtual reality computer game communicate with the cloud must be one of the most interesting things you can do in my line of work. Abstracting the game options and content has also left us with something immediately re-usable, a VR research tool that can deliver any question set without being rebuilt, which is pretty cool to say the least!
I just hope the users at the conference have the same reaction that we’ve had throughout building it:
“Can I play again?”